
 By now, we have already established that Kidero has done nothing meaningful for Nairobi. A recent ranking of cities in the world with the worst traffic should be enough to convince Nairobians not to vote for him in 2017.
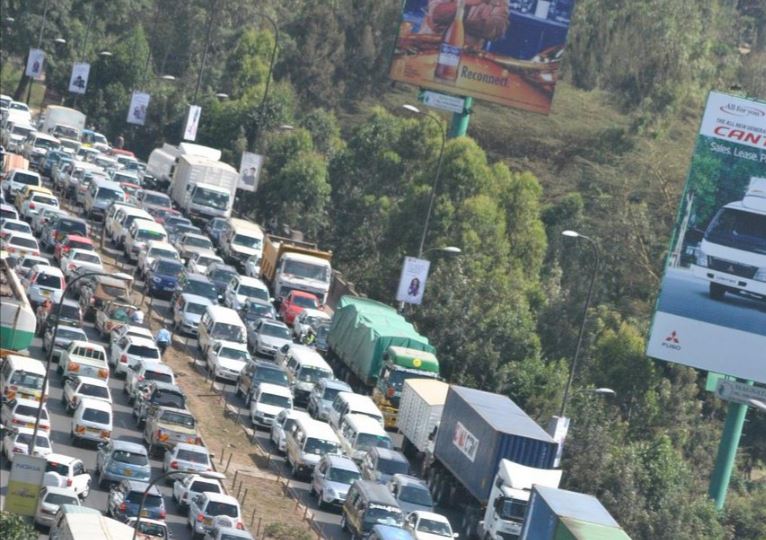
Nairobi is ranked 9th city in the world with the worst traffic and high carbon dioxide emission index.
The ranking was arrived at by using a ‘Time Index’ that factors in the average time spent by a commuter on a one-way trip.
The average time spent in traffic in Nairobi is 65.2o minutes.
The study was released by Numbeo, a website that collates global information related to costs of living, crime rates and pollution.
Other factors include ‘Inefficiency Index’, which comprises of long commute hours, poor traffic laws, driving, etc.
A government survey released in May 2016, time wasted in traffic jams represents a cost Sh58.4 million a day in lost productivity.
In Africa, Nairobi comes in at third after Pretoria in South Africa and Cairo, Egypt.
Here is the top 10 list:
1. Manila, Philippines – Time Index (in mins): 54.33 Inefficiency Index: 248.10 CO2 Emission Index: 9471.67
2. Pretoria, South Africa – Time Index (in mins): 52.25 Inefficiency Index: 355.08 CO2 Emission Index: 11515
3. Recife, Brazil – Time Index (in mins): 57.85 Inefficiency Index: 474.75 CO2 Emission Index: 8130.77
4. Tehran, Iran – Time Index (in mins): 59.84 Inefficiency Index: 237.80 CO2 Emission Index: 8604. 11
5. Miami, Florida – Time Index (in mins): 59.20 Inefficiency Index: 340.41 CO2 Emission Index: 9908.80
6. Kolkata, India – Time Index (in mins): 58 Inefficiency Index: 397.79 CO2 Emission Index: 11179.60
7. Cairo, Egypt – Time Index (in mins): 58.61 Inefficiency Index: 309.21 CO2 Emission Index: 13010.67
8. Pune, India –Time Index (in mins): 60.86 Inefficiency Index: 244.01 CO2 Emission Index: 12215.71
9. Nairobi, Kenya – Time Index (in mins): 65.20 Inefficiency Index: 253.96 CO2 Emission Index: 7123.60
10. Mumbai, India – Time Index (in mins): 66.18 Inefficiency Index: 263.03 CO2 Emission Index: 6581.18
-nairobiwire.com